源码介绍
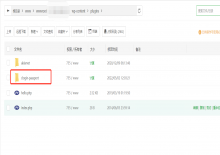
此wordpress插件的编码为UTF,适用版本wordpress5.0.x,其他版本自行测试。插件大小:1.5KB
插件介绍
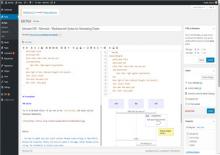
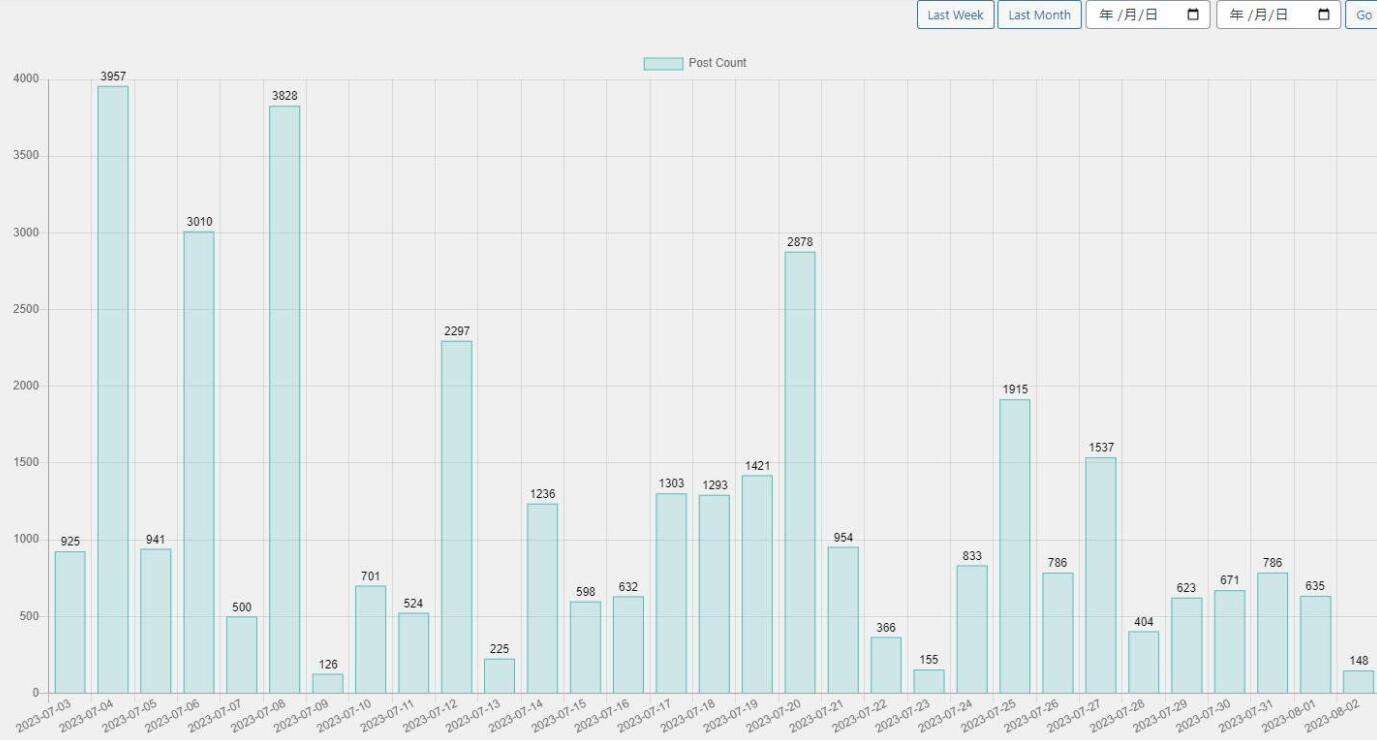
wordpress统计每日发布文章数量插件,可以统计每天发了多少文章,用ai写的插件,功能比较简单,效果如下:
插件代码:
<?php

/*

Plugin Name: 文章发布数量统计

Plugin URI:

Description: 用来统计每日发布文章数量。

Version: 1.0

Author: tien

Author URI:

*/


function get_daily_post_counts($start_date, $end_date) {

    global $wpdb;


    $query = $wpdb->prepare("

        SELECT DATE(post_date) AS post_date, COUNT(*) AS post_count

        FROM $wpdb->posts

        WHERE post_status='publish' AND post_date BETWEEN %s AND %s

        GROUP BY DATE(post_date)

        ORDER BY post_date ASC

    ", $start_date, $end_date);


    return $wpdb->get_results($query);

}


function render_date_range_buttons() {

    $base_url = remove_query_arg(array('start_date', 'end_date'));


    $buttons = array(

        'Last Week' => array(date('Y-m-d', strtotime('-1 week')), date('Y-m-d')),

        'Last Month' => array(date('Y-m-d', strtotime('-1 month')), date('Y-m-d')),

    );


    echo '<div style="text-align: right; margin-bottom: 20px;">';


    foreach ($buttons as $label => $dates) {

        $url = add_query_arg(array('start_date' => $dates[0], 'end_date' => $dates[1]), $base_url);

        echo '<a href="' . esc_url($url) . '" class="button">' . esc_html($label) . '</a> ';

    }


    // Custom date range form

    echo '

    <form method="get" style="display: inline;">

        <input type="hidden" name="page" value="post-stats">

        <input type="date" name="start_date">

        <input type="date" name="end_date">

        <input type="submit" value="Go" class="button">

    </form>';


    echo '</div>';

}


function render_post_stats_page() {

    $start_date = isset($_GET['start_date']) ? $_GET['start_date'] : date('Y-m-d', strtotime('-1 month'));

    $end_date = isset($_GET['end_date']) ? $_GET['end_date'] : date('Y-m-d');


    render_date_range_buttons();


    $post_counts = get_daily_post_counts($start_date, $end_date);


    // Convert the data to the format required by Chart.js

    $labels = array();

    $data = array();


    foreach ($post_counts as $post_count) {

        $labels[] = $post_count->post_date;

        $data[] = $post_count->post_count;

    }


    // Output the chart container

    echo '<canvas id="postStatsChart"></canvas>';


    // Output the chart script

    echo '

<script>

var ctx = document.getElementById("postStatsChart").getContext("2d");

var myChart = new Chart(ctx, {

    type: "bar",

    data: {

        labels: ' . json_encode($labels) . ',

        datasets: [{

            label: "Post Count",

            data: ' . json_encode($data) . ',

            backgroundColor: "rgba(75, 192, 192, 0.2)",

            borderColor: "rgba(75, 192, 192, 1)",

            borderWidth: 1

        }]

    },

    options: {

        scales: {

            yAxes: [{

                ticks: {

                    beginAtZero: true

                }

            }]

        },

        plugins: {

            datalabels: {

                display: true,

                color: "black",

                align: "start",

                anchor: "end",

                offset: -20,

                formatter: function(value, context) {

                    return value;

                }

            }

        }

    }

});

</script>

';

}


function post_stats_menu() {

    add_menu_page('Post Stats', 'Post Stats', 'manage_options', 'post-stats', 'render_post_stats_page');

}


function post_stats_scripts() {

    wp_enqueue_script('chartjs', 'https://cdn.jsdelivr.net/npm/chart.js@2.9.4');

    wp_enqueue_script('chartjs-datalabels', 'https://cdn.jsdelivr.net/npm/chartjs-plugin-datalabels@0.7.0');

}


add_action('admin_menu', 'post_stats_menu');

add_action('admin_enqueue_scripts', 'post_stats_scripts');

?>
源码下载地址
下载即代表您已阅读并同意以下条款:
1、所有资源仅供学习与参考,请学习后自行删除。本站不提供任何技术支持。
2、本站不保证资源的完整性、可用性、安全性。(单独付费源码除外)
3、如有侵犯您的版权,请及时联系我们,我们将下架处理。
1、所有资源仅供学习与参考,请学习后自行删除。本站不提供任何技术支持。
2、本站不保证资源的完整性、可用性、安全性。(单独付费源码除外)
3、如有侵犯您的版权,请及时联系我们,我们将下架处理。


